“Photometric Catalogue for Space and Ground Night-Time Remote-Sensing Calibration: RGB Synthetic Photometry from Gaia DR3 Spectrophotometry “

“Photometric Catalogue for Space and Ground Night-Time Remote-Sensing Calibration: RGB Synthetic Photometry from Gaia DR3 Spectrophotometry “

“RGB photometric calibration of 15 million Gaia stars”

“Synthetic RGB photometry of bright stars: definition of a standard photometric system and UCM library of spectrophotometric spectra”

Paper 3 Carrasco et al. (2023)
Paper 2 Cardiel et al. (2021b)
Paper 1 Cardiel et al. (2021a)
While the use of RGB photometry has surged in recent decades due to the availability of high-quality, affordable digital cameras with Bayer-like color filter systems, there surprisingly hasn’t been a catalog of reference stars specifically for calibration purposes.
In ‘Paper 1’, we presented an inaugural catalogue of 1,346 flux-calibrated stellar spectra. This alone serves as a substantial library of bright spectrophotometric standards apt for spectroscopic calibrations. Furthermore, we defined average RGB spectral sensitivity curves, paving the way for establishing a standard RGB photometric system. From the 1,346 flux-calibrated stellar spectra, we derived synthetic RGB magnitudes, creating a reference catalog for RGB magnitudes. ‘Paper 2’ temporarily expanded the RGB magnitude predictions to encompass 15 million objects, utilizing data from Gaia EDR3. Finally, ‘Paper 3’ has delivered an even more comprehensive and trustworthy RGB sample, covering over 200 million objects, drawing upon the spectroscopic data released in Gaia DR3.
We hope this data will serve as a benchmark for future research in various astronomical fields. The collaboration of numerous observers using high-quality digital cameras can potentially provide invaluable data to further propel advancements in research.
This has the potential to elevate citizen science in the field of astronomy, bolstering public interest and comprehension of science, and underscoring the significance of scientific research.
The advent of high-quality and relatively inexpensive digital cameras, equipped with Bayer-like color filter systems, is making citizen science a reality in the realm of astronomy. Market studies (Nisselson et al. 2017) already estimated that by 2022 as much as 45 billion cameras would be operative worldwide.

Photo credit: Jaime Izquierdo
A Bayer filter mosaic is a color filter array for arranging RGB (Red/Green/Blue) color filters on a square grid of photosensors. Its particular arrangement of color filters is used in most single-chip digital image sensors used in digital cameras, camcorders, and scanners to create a color image. Although these filters are different from those typically employed in optical studies by professional astronomers, the relative similarity of the R, G, and B channels across camera models, and their expected stability in the foreseeable future (as far as cameras continue to be developed for human vision-driven applications) are two key features enabling the scientific usefulness of these devices.
Since RGB filters differ from those typically used in optical studies by professional astronomers, there was no standard catalogue of bright stars for calibration purposes when we embarked on this project in 2021. Our aim has been to address this gap. In ‘Paper 1’, we developed a library of 1,346 model spectra capable of replicating high-quality historical photometric data of bright stars. Our subsequent research, documented in ‘Papers 2 and 3’, expanded upon this foundation, leveraging Gaia’s spectrophotometric data.
Below are the findings from ‘Paper 1’. For results from ‘Papers 2 and 3’, please refer to the links provided at the beginning of this webpage.

Photometric data of superb quality was gathered by Johnson & Mitchell (1975) in 13 photometric bands (the so called C13 system) for most bright stars in the sky. Similar measurements were obtained later by Schuster (1976) and Bravo Alfaro et al. (1997) for some additional, but fainter, stars. The spectral sensitivity curves of the 13 filters are shown in the figure. The name of each filter indicates its approximate effective wavelength. Just for illustration, we are also displaying the atmospheric telluric absorption (upper gray line) computed with the help of the ESO SKYCALC tool (Moehler et al. 2014).
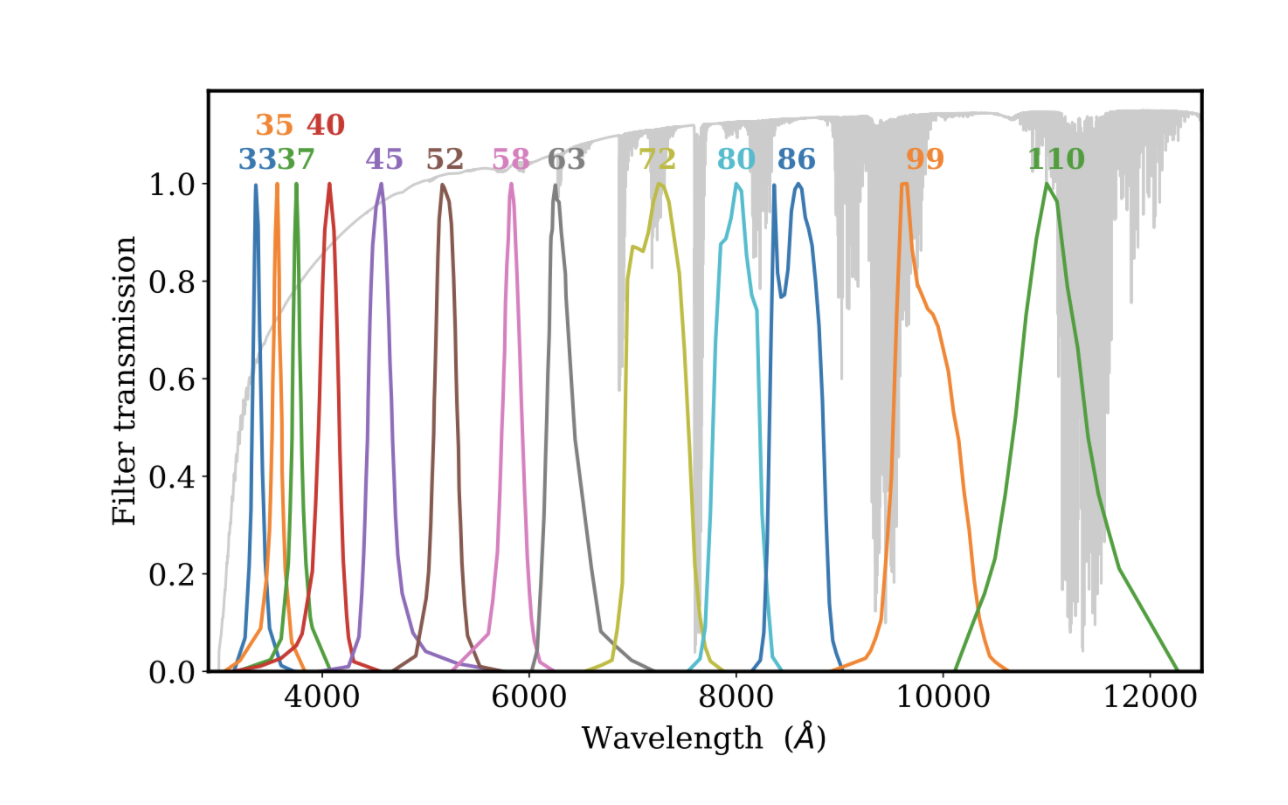
Photometric data of superb quality was gathered by Johnson & Mitchell (1975) in 13 photometric bands (the so called C13 system) for most bright stars in the sky. Similar measurements were obtained later by Schuster (1976) and Bravo Alfaro et al. (1997) for some additional, but fainter, stars. The spectral sensitivity curves of the 13 filters are shown in the figure. The name of each filter indicates its approximate effective wavelength. Just for illustration, we are also displaying the atmospheric telluric absorption (upper gray line) computed with the help of the ESO SKYCALC tool (Moehler et al. 2014).

Since the historical 13C data only provided 13 fluxes for each star, a full spectrum, computed using the Stellar Atmosphere Models by Castelli & Kurucz (2003), have been individually fitted, providing an excellent model of optical spectral energy distribution. The figure on the left illustrates several examples of spectrum fits to stars with different effective temperatures.
We have checked that the fitted models do actually agree very well with real available spectra of 39 bright stars observed by Kiehling (1987). Some examples are shown in the figure, where the thin black lines are Kiehling’s flux calibrated spectra, whereas the thick blue/orange lines correspond to the stellar models, fitted to the C13 data (red symbols).
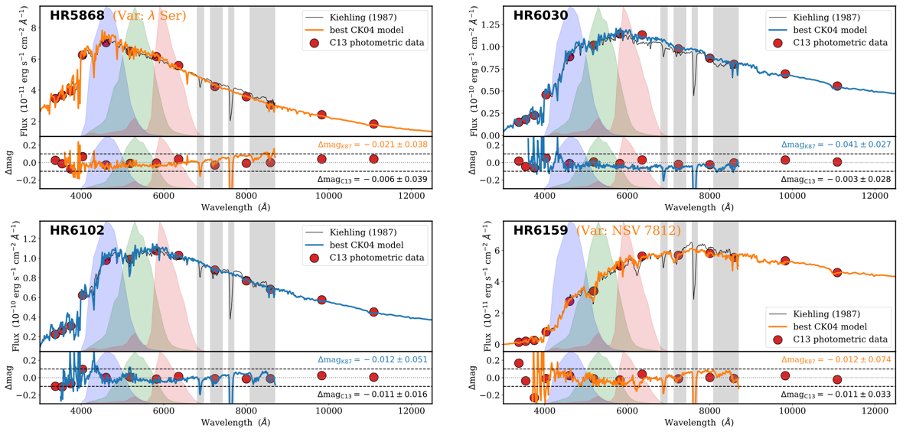
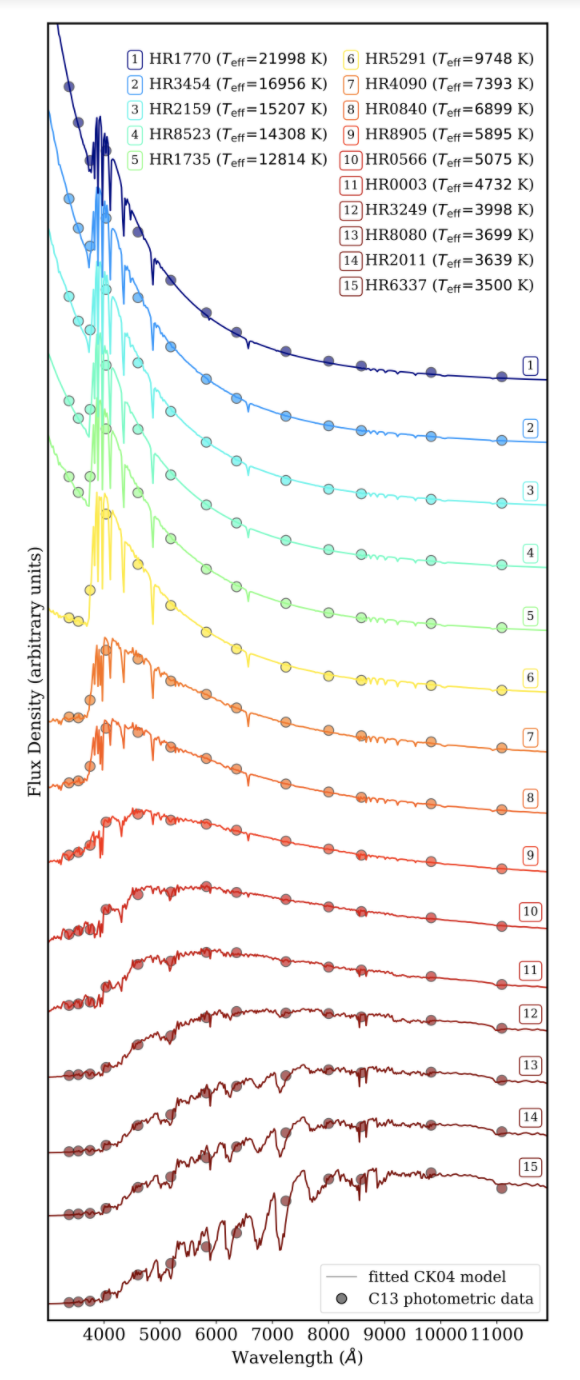
Since the historical 13C data only provided 13 fluxes for each star, a full spectrum, computed using the Stellar Atmosphere Models by Castelli & Kurucz (2003), have been individually fitted, providing an excellent model of optical spectral energy distribution. The figure below illustrates several examples of spectrum fits to stars with different effective temperatures.

We have checked that the fitted models do actually agree very well with real available spectra of 39 bright stars observed by Kiehling (1987). Some examples are shown in the figure, where the thin black lines are Kiehling’s flux calibrated spectra, whereas the thick blue/orange lines correspond to the stellar models, fitted to the C13 data (red symbols).

In order to generate a catalogue of reference RGB calibrating stars, it is important to properly define the spectral sensitivity curves of the 3 filters. For that purpose we have used the response curves measured by Jiang et al. (2013) for 28 cameras: Canon 1DMarkIII, Canon 20D, Canon 300D, Canon 40D, Canon 500D, Canon 50D, Canon 5DMarkII, Canon 600D, Canon 60D, Hasselblad H2, Nikon D3X, Nikon D200, Nikon D3, Nikon D300s, Nikon D40, Nikon D50, Nikon D5100, Nikon D700, Nikon D80, Nikon D90, Nokia N900, Olympus E-PL2, Pentax K-5, Pentax Q, Point Grey Grasshopper 50S5C, Point Grey Grasshopper2 14S5C, Phase One, and SONY NEX-5N. The individual curves corresponding to each camera (thin lines in the figure) have been averaged by computing the median values at each sampled wavelength (thick lines). These are median curves that we have adopted to define the standard RGB photometric system, and their spectral sensitivity values are listed in the dropdown menus.
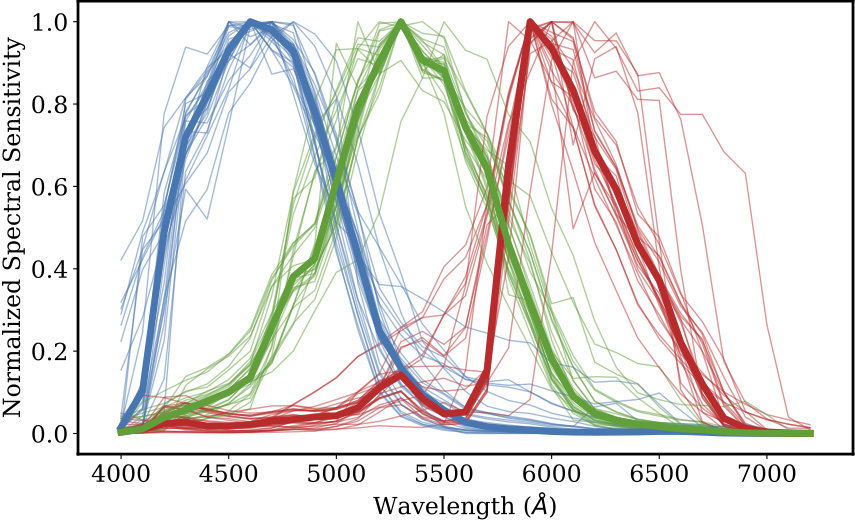
3990.0  0.000000e+00
4000.0  1.504283e-02
4100.0  1.039736e-01
4200.0  4.892935e-01
4300.0  7.202255e-01
4400.0  8.216436e-01
4500.0  9.308637e-01
4600.0  1.000000e+00
4700.0  9.802917e-01
4800.0  9.275882e-01
4900.0  7.807393e-01
5000.0  6.143757e-01
5100.0  4.338580e-01
5200.0  2.491595e-01
5300.0  1.594246e-01
5400.0  9.478547e-02
5500.0  5.672213e-02
5600.0  2.732143e-02
5700.0  1.661261e-02
5800.0  1.141002e-02
5900.0  8.477845e-03
6000.0  4.891583e-03
6100.0  3.422961e-03
6200.0  2.965799e-03
6300.0  3.285335e-03
6400.0  3.795944e-03
6500.0  5.100955e-03
6600.0  5.076481e-03
6700.0  3.265961e-03
6800.0  1.129443e-03
6900.0  5.126654e-04
7000.0  2.948293e-04
7100.0  1.016809e-04
7200.0  6.157581e-05
7210.0  0.000000e+00
3990.0  0.000000e+00
4000.0  3.084000e-03
4100.0  1.135700e-02
4200.0  3.887250e-02
4300.0  5.753950e-02
4400.0  7.919100e-02
4500.0  1.006650e-01
4600.0  1.360232e-01
4700.0  2.571178e-01
4800.0  3.809050e-01
4900.0  4.251800e-01
5000.0  6.113000e-01
5100.0  7.933000e-01
5200.0  9.033850e-01
5300.0  1.000000e+00
5400.0  9.064100e-01
5500.0  8.807233e-01
5600.0  7.437300e-01
5700.0  6.428150e-01
5800.0  4.597650e-01
5900.0  3.175050e-01
6000.0  1.819950e-01
6100.0  8.972300e-02
6200.0  4.853900e-02
6300.0  3.160450e-02
6400.0  2.298700e-02
6500.0  1.676700e-02
6600.0  1.128295e-02
6700.0  8.819030e-03
6800.0  4.677050e-03
6900.0  1.687100e-03
7000.0  7.490450e-04
7100.0  3.076779e-04
7200.0  1.487700e-04
7210.0  0.000000e+00
3990.0  0.000000e+00
4000.0  3.496976e-03
4100.0  1.038916e-02
4200.0  2.382697e-02
4300.0  2.776679e-02
4400.0  1.800560e-02
4500.0  1.803599e-02
4600.0  2.186831e-02
4700.0  2.991320e-02
4800.0  3.396205e-02
4900.0  4.018768e-02
5000.0  4.308463e-02
5100.0  6.251524e-02
5200.0  1.111756e-01
5300.0  1.419566e-01
5400.0  8.498971e-02
5500.0  4.781299e-02
5600.0  5.215874e-02
5700.0  1.533735e-01
5800.0  6.503433e-01
5900.0  1.000000e+00
6000.0  9.353758e-01
6100.0  8.337379e-01
6200.0  6.858826e-01
6300.0  5.929939e-01
6400.0  4.600072e-01
6500.0  3.717754e-01
6600.0  2.205769e-01
6700.0  1.200198e-01
6800.0  3.715120e-02
6900.0  1.260716e-02
7000.0  3.716883e-03
7100.0  1.210464e-03
7200.0  5.449463e-04
7210.0  0.000000e+00
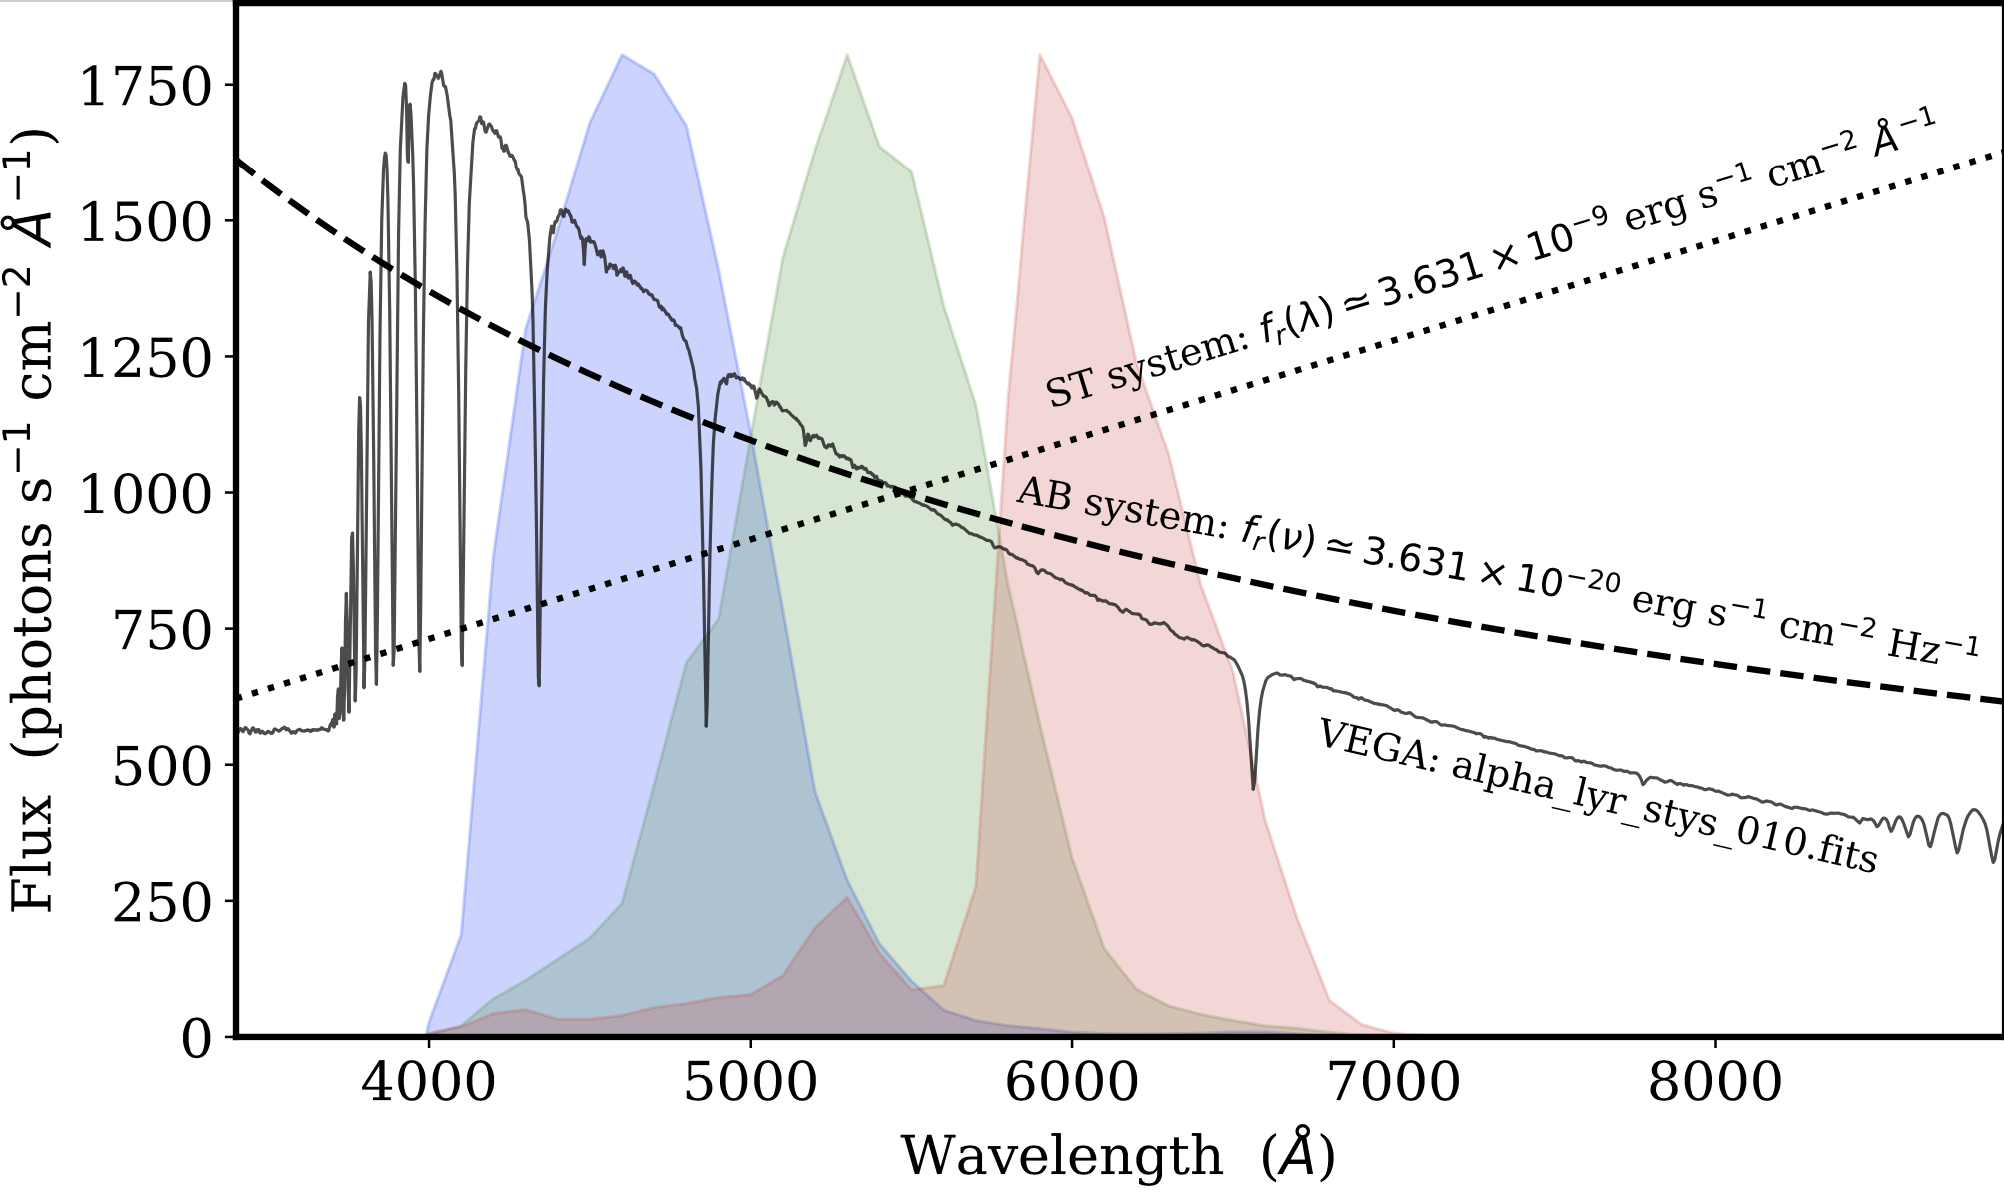
Another basic ingredient in the definition of a photometric system is the adoption of a reference spectral energy distribution to define the zero point of the magnitude system. Although for many years astronomers have employed the spectrum of Vega for such a reference, magnitude scales using fixed flux densities per unit frequency (AB system) or per unit wavelength (ST system) are becoming more frequent (see comparison of the 3 reference spectra in the figure). In this work we have adopted the reference corresponding to the AB system.
Relevant filter information, including the corresponding zeropoints, are provided through the Filter Profile Service Carlos Rodrigo, hosted by the Spanish Virtual Observatory.
Our final bright star sample comprises 1346 objects, well spread in the sky, whose RGB magnitudes in the standard system are provided in the tables below. In addition, we also facilitate the fitted stellar model for each star, which can be employed as spectrophotometric calibrators for spectroscopic studies.
If you click on the following image a table as show below will open in another tab. The first column in the table below provides a link to the Simbad database, the second one a link to a PDF plot with the best CK04 fit to the C13 color photometry, on the third you will find a binary FITS table with the corresponding spectrum. If you follow the ASCII link, you will get a file with the same spectrum.
Appendices A and B: Comparison with CK04 and transformations to the standard RGB system
Download the table here:
Download the full table here:
Download all the spectra below:

PhD. Astrophysics
Professional astronomer and professor at UCM.

PhD. Astrophysics
Professional astronomer and astrophysics professor at UCM.

PhD. Physics
Associate profesor at Universidade de Santiago de Compostela.

PhD. Astrophysics
PhD. Astrophysics. Postdoc researcher at Exeter University.

Astrophysics master
Physics graduate. Predoctoral researcher at Universidad Complutense de Madrid.

PhD. Physics
GUAIX Director and astrophysics professor at UCM.

Physics degree
Physics graduate with media communications expertise.

Telecommunication Engineer
Laboratory Technician at LICA.

PhD. Astrophysics
Astronomer, astrophotographer and honorary collaborator at the Department of Astrophysics.

PhD. Astrophysics
Astrophysicist and Computer Engineer. Assistant professor at UCM.

Nuclear Science master
Physics graduate. Predoctoral researcher at Universidad Complutense de Madrid.

Research and Innovation Management master
Project manager of the GUAIX Group at the UCM.

Optical engineer
Optical Engineer at Escribano Mechanical & Engineering
Contact
Nicolás Cardiel:
cardiel@ucm.es